


The Federal Reserve’s March 20th policy update led many investors to speculate that not only was the Fed pausing on any further interest rate increases, but their next move was more likely to be lowering rates rather than raising them. This view, in conjunction with the decision to end Quantitative Tightening (QT) at the end of September, has resulted in a quarter percentage point decrease in long-term yields. This shift has produced an inversion in the yield curve where the interest rate on 3-month Treasury bills is now higher than the rate on 10-year Treasury bonds.
A yield curve inversion is viewed as a precursor to a recession. Market participants have typically looked at the spread between 2-year and 10-year Treasuries as the primary indicator of a yield curve inversion. To date, the spread between the 2-year and 10-year bonds remains just above zero, although the current inversion between the 3-month and 10-year may be a precursor.
The chart below shows the historical interest rate spread between 2-year and 10-year Treasuries. A spread below zero indicates an inversion in the yield curve. The vertical gray bars highlight recessions. The chart depicts how the recessions experienced since 1976 have all been preceded by a yield curve inversion, but often the inversion happens a year or more before the recession actually occurs.
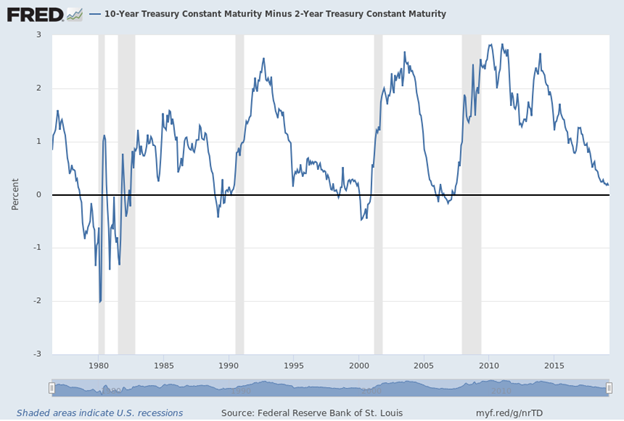
Source: FRED Economic Database, Federal Reserve Bank of St. Louis
While an inversion in the current yield curve may be an ominous sign of what’s on the horizon, there are many elements of the current economic climate that are unique or even unprecedented. First, U.S. interest rates remain higher than other developed geographies, such as Europe, where interest rates are negative. The desperate search for yield has led some international investors toward U.S. Treasury bonds as they offer comparably better yields and limited risk. This demand leads to higher prices, and since rates move inversely to price, results in a lower yield.
Second, the Federal Reserve’s deployment of quantitative easing has impacted the supply/demand dynamics of the Treasury market. Initially, the Fed purchased a significant amount of bonds. This demand led to higher prices and pressured yields. As this tactic shifted to quantitative tightening, the absence of the Federal Reserve in the market led to Treasury prices slowly drifting lower, resulting in slightly higher yields. As the Fed ends QT, it is unclear how this may impact the Treasury market going forward.
Lastly, the Fed appears to be more attentive to market indicators than it may have under past Fed Chairman. For example, in December, the Fed raised rates by a quarter percent, but the subsequent market selloff may have led to the Fed’s shift toward a more dovish stance. Speaking recently regarding the yield curve inversion, Dallas Fed President Robert Kaplan was quoted in the Wall Street Journal stating, “If an inversion goes on for several months…then it’s a different kettle of fish”. Therefore, a yield curve inversion could be short lived if the Fed is more open to considering market indicators as an input into its policy decisions.
The inversion in the yield curve should be viewed by investors as a sign of caution. Historically it has been a reliable indicator that a recession is on the horizon. However, one can convincingly argue that there are several considerations where it might just be different this time. We believe now is a time for investors to be pragmatic in recognizing we may be entering a market environment of greater uncertainty and higher volatility. Volatility often leads to greater long-term opportunities in the market, but it’s never enjoyable when you go through it. Therefore, now is the time for investors to ensure their portfolios reflect their true risk tolerance.