


Telemus Weekly Market Review September 19th - September 23rd, 2022
Stocks and bonds continued to decline this past week after investors reacted to updated guidance out of the Federal Reserve. As expected, the Fed’s Federal Open Market Committee (FOMC) raised interest rates by three quarters of a percent. The fed funds rate, the interest rate the FOMC controls, now sits at a range of 3.00% to 3.25%. This has risen a full three percentage points from where it stood at the start of the year.
What caught investor’s attention wasn’t the rate hike, that was expected, but the updated forecasts that are provided by members of the FOMC each quarter. Expectations showed members expected an additional 1.25% increase in the fed funds rate by year end. The Treasury yield curve reacted with yields finishing the week up over a quarter of a percent on 2-year and 5-year Treasuries. The yield curve now has an even more inverted slope, meaning 2-year Treasuries offer a half percent higher interest rate than 10-year Treasuries. An inverted yield curve of this magnitude has not occurred since 1981. Inverted yield curves indicate expectations for less optimistic economic expectations going forward.
Another notable takeaway from FOMC projections were both economic growth and unemployment. Members of the FOMC indicated they expect unemployment to edge (slightly) higher over the next year. Expectations for economic growth were lower than previous forecasts and more importantly indicated an expectation that they would remain below the long-term trend until 2025. These revised projections, which were last updated a mere three months ago, signaled that the Fed recognizes its hawkish monetary policy is going to notably slow the economy. Moreover, the Fed seems willing to accept the risk that they could push the economy into a recession in order to control inflation.
While its important to understand expectations from the Fed, these are just forecasts and the Fed falls susceptible to estimation errors just like other economists. This is evident from the fact that the Fed’s forecasts at the beginning of the year are notably different than they are today. Therefore, one must consider them but can’t assume they will play out as projected.
These more sobering forecasts resulted in a decline for the S&P 500, which fell -4.6% this past week. This marked the second straight week where the market fell close to -5%. Since its most recent peak on August 16th, the S&P 500 has lost -14.1%, while bonds have declined by -5.5%¹. While this drawdown has been unnerving, its important to put the longer-term perspective into perspective. The chart looks at the return of the S&P 500 over the last five years, where it has returned +9.5% over this time². The orange line in the chart below depicts a steady compounding of the 9.5% return. Alternatively, the blue line charts the return of the S&P 500. We find this chart appropriate as a 9.5% return for stocks is a sound and reasonable long-term projection. Prior to this year’s drop, the S&P 500 had outpaced the steady 9.5% trend. The retrenchment from this year now takes the trailing 5-year return back to this level. If you would have suggested to us five years ago that stocks would have returned 9.5%, we’d have been happy to take that result.
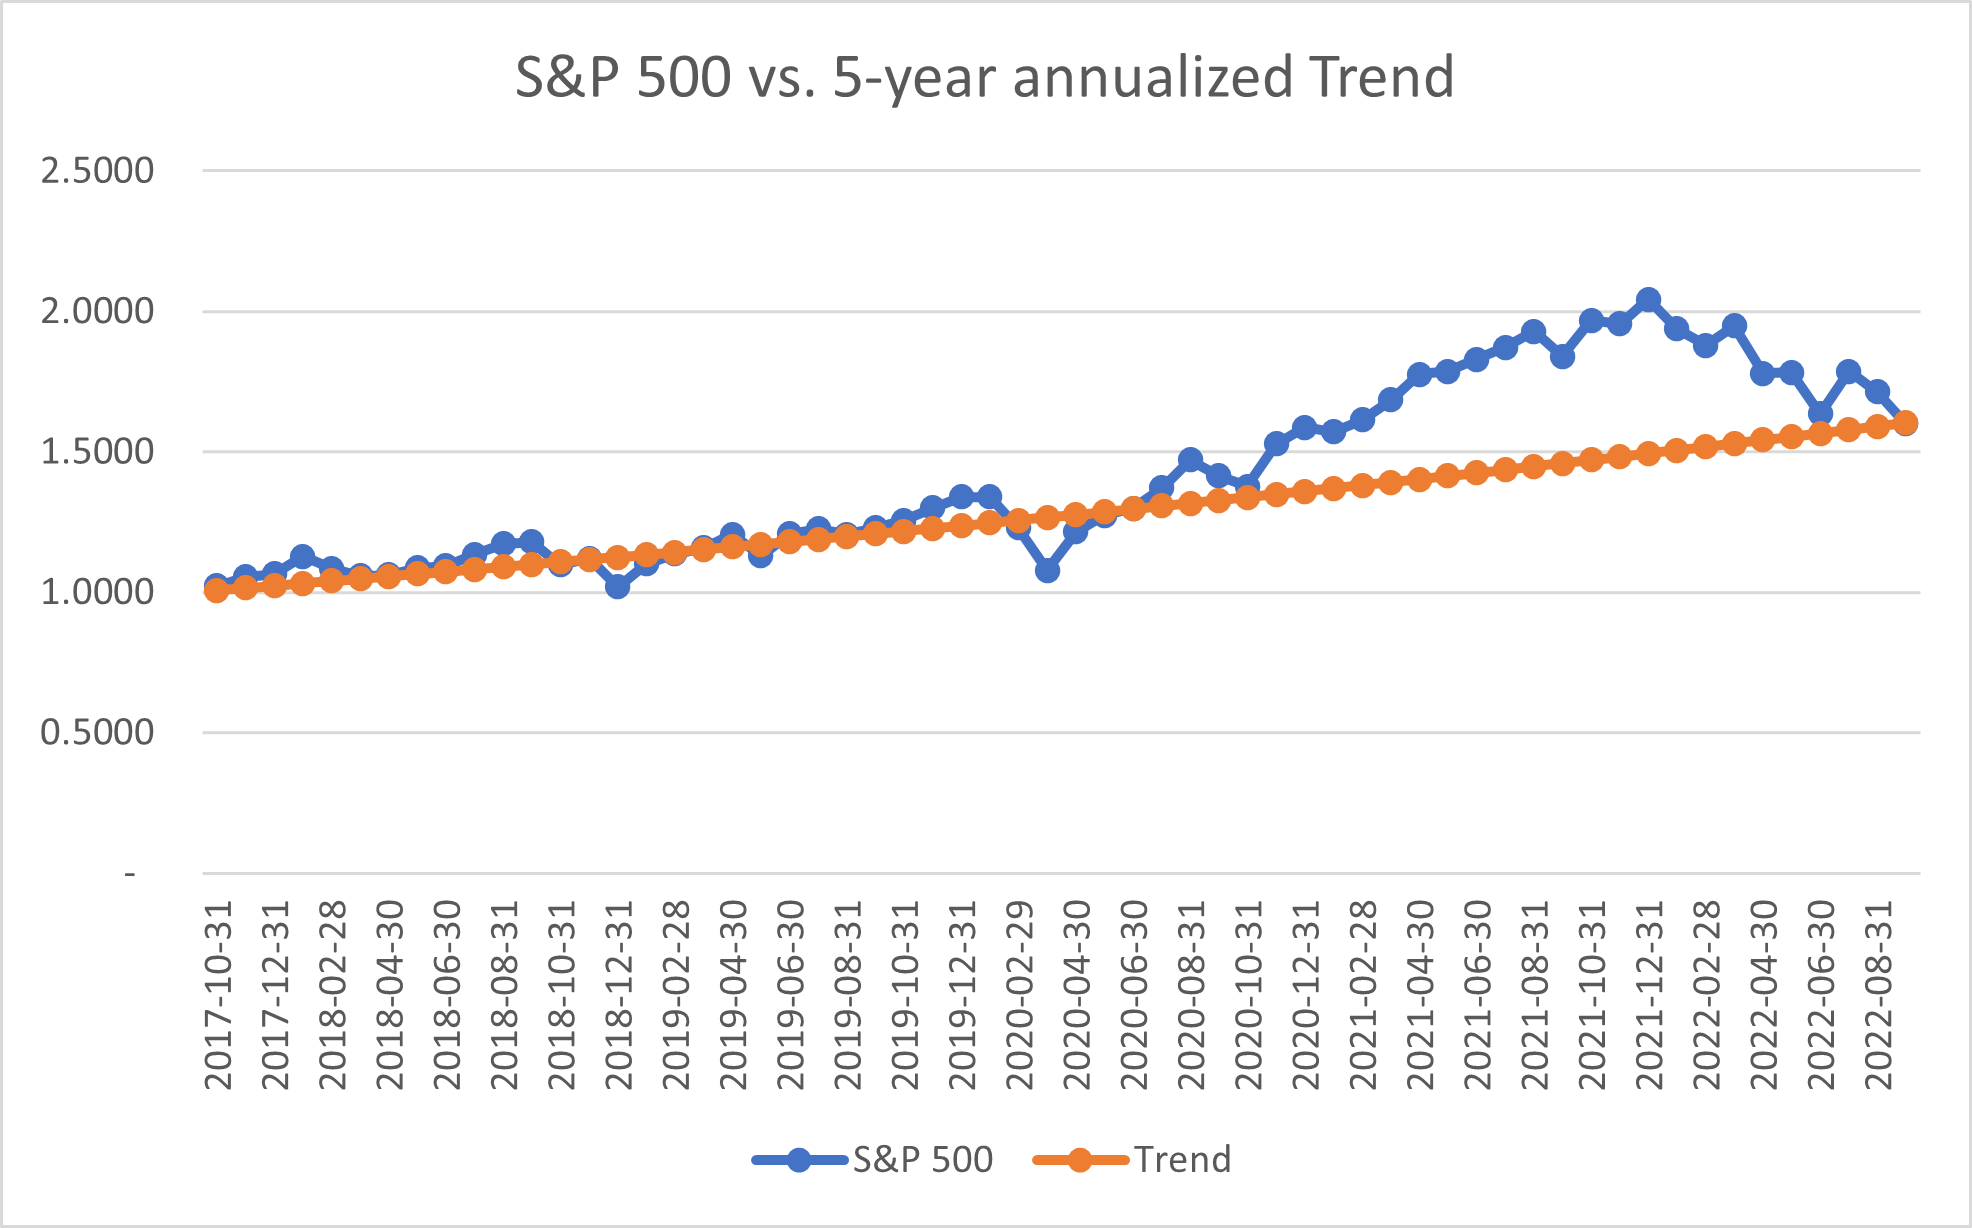 Source: Standard & Poors, Bloomberg, Telemus Capital
Keeping the bigger picture in mind during episodes of uncertainty and turbulence is important in not letting behavioral tendencies influence decisions. There remain a lot of uncertainties around the economy, consumer psychology and geopolitical events that make it hard to predict any outcome with certainty. It’s during periods such as this where having broad based diversification is most needed. Diversification extends beyond just stocks and bonds, and includes thoughtful exposures to various assets within these broad asset classes. We spend a lot of time analyzing and discussing this, with the long-term outcome in mind. We’ve seen uncertain markets before. We know that they often offer outsized opportunities at points along the way, but it’s impossible to predict the when and the how. Staying diversified, understanding risks, and tilting to those that are appear most favorable is the approach we believe is most prudent in these environments.
¹As reference by the Bloomberg U.S. Aggregate index. August 16, 2022 through September 23, 2022.
²Source: Standard & Poors, Bloomberg.
All opinions expressed in this article are for general informational purposes and constitute the judgment of the author(s) as of the date of the report. These opinions are subject to change without notice and are not intended to provide specific advice or recommendations for any individual or on any specific security. The material has been gathered from sources believed to be reliable, however Telemus Capital cannot guarantee the accuracy or completeness of such information, and certain information presented here may have been condensed or summarized from its original source. PAST PERFORMANCE IS NOT A GUARANTEE OF FUTURE RESULTS. Investment decisions should always be made based on the client's specific financial needs, goals and objectives, time horizon and risk tolerance. Current and future portfolio holdings are subject to risk. Risks may include interest-rate risk, market risk, inflation risk, deflation risk, currency risk, reinvestment risk, business risk, liquidity risk, financial risk, and cybersecurity risk. These risks are more fully described in Telemus Capital's Firm Brochure (Part 2A of Form ADV), which is available upon request. Telemus Capital does not guarantee the results of any investments. Investment, insurance and annuity products are not FDIC insured, are not bank guaranteed, and may lose value. Any reference to an index is included for illustrative purposes only, as an index is not a security in which an investment can be made. Indices are unmanaged vehicles that serve as market indicators and do not account for the deduction of management fees and/or transaction costs generally associated with investable products. The S&P 500 index includes 500 leading companies in the US and is widely regarded as the best single gauge of large-cap US equities. The Bloomberg Barclays US Aggregate Bond is a broad-based flagship benchmark that measures the investment grade, US dollar-denominated, fixed-rate taxable bond market.
Advisory services are only offered to clients or prospective clients where Telemus and its representatives are properly licensed or exempt from licensure. No advice may be rendered by Telemus unless a client service agreement is in place. All composite data and corresponding calculations are available upon request.