


Repricing Risk
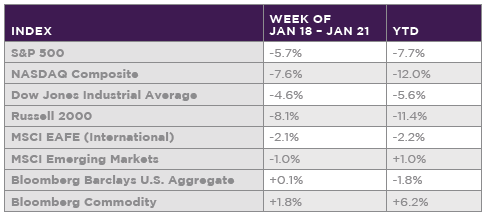
Stocks continued their sour start to 2022, marking their worst weekly return of the year as the S&P 500 sank -5.7%. Returns were most challenged for the technology heavy NASDAQ Composite, which dropped -7.6%. Bonds, which have been negatively impacted by rising interest rates were able to stabilize as interest rates were generally flat on the week. The market concluded the week at an interesting technical level with the S&P 500 finishing below its 200-day moving average, a key technical point of support.
Thus far in 2022, investors have been taking action to reprice risk in advance of tighter monetary policy, electing to adjust positions as we’ve flipped to a new tax year, and enacting scheduled rebalances of portfolios back to targets after a diverse range of asset returns in 2021. Recall the S&P 500 was up 11% in the fourth quarter of 2021. This came during a period when the Fed indicated they would be accelerating their timeline for winding down their asset purchase program, raising rates quicker than expected, and even considering reducing the size of their balance sheet. Despite these significant shifts in policy, the market didn’t seem to bat an eye, pushing these concerns into a new tax year.
While the pace of the downdraft has been a bit unexpected, we view it to be a rationale reaction for the market. Stock that are more sensitive to rising rates, such as higher multiple/high growth stocks are seeing their prices cut the most. The yield curve is now reacting and has begun to price in expectations of future fed actions. While not pleasant to go through, this is how markets should behave and these short-term movements should set up for more stable conditions over the long-term.
What 2022 has shown thus far is the power of diversification. Yes, stocks and bonds are both down. However, within each asset class there is a fairly wide bifurcation of returns. Among equities, the S&P 500 is down -7.7% year-to-date. However, if you dissect returns across growth and value styles, growth is down -12.3% versus a much more modest decline of -3.6% for valuei. Outside the U.S. declines have not been as severe with developed international markets retreating by only -2.2%. The standout has been emerging market stocks, which was the laggard last year posting a negative return. Thus far in 2022, emerging market returns are up a positive +1%.
For the past eighteen months market volatility has largely only occurred on the upside. As such, risk tolerances have grown, and some investors have been willing to accept more risk in their portfolios. As markets face the prospect of a rising rate cycle out of the Fed, we are beginning to see a repricing of risk. By repricing of risk we mean that valuation multiples reprice lower to reflect the underlying risk in stocks. This often leads to the highest multiple stocks being hit the hardest. This repricing will likely take some time to work through as higher multiple, negative earners arguably having more room to fall. Economic indicators and what we are seeing out of corporate earnings reports indicate sound fundamental conditions. Given that high yield spreads remain near record lows adds support to the fact that what is occurring in equities is a repricing of risk and not a function of deterioration in the economy or business conditions.
We see this year as being tricky as a hawkish Fed is becoming less predictable having to react to heightened inflation. It’s only natural to expect more up and down movements ahead for the market. Having diversification across and within asset classes, and not relying on what worked in 2021, is the right approach as conditions are changing.
i Growth stocks are referred by the Russell 1000 Growth index and value by the Russell 1000 Value.
All opinions expressed in this article are for general informational purposes and constitute the judgment of the author(s) as of the date of the report. These opinions are subject to change without notice and are not intended to provide specific advice or recommendations for any individual or on any specific security. The material has been gathered from sources believed to be reliable, however Telemus Capital cannot guarantee the accuracy or completeness of such information, and certain information presented here may have been condensed or summarized from its original source. PAST PERFORMANCE IS NOT A GUARANTEE OF FUTURE RESULTS. Investment decisions should always be made based on the client's specific financial needs, goals and objectives, time horizon and risk tolerance. Current and future portfolio holdings are subject to risk. Risks may include interest-rate risk, market risk, inflation risk, deflation risk, currency risk, reinvestment risk, business risk, liquidity risk, financial risk, and cybersecurity risk. These risks are more fully described in Telemus Capital's Firm Brochure (Part 2A of Form ADV), which is available upon request. Telemus Capital does not guarantee the results of any investments. Investment, insurance and annuity products are not FDIC insured, are not bank guaranteed, and may lose value.
The S&P 500® is widely regarded as the best single gauge of large-cap U.S. equities. There is over USD 11.2 trillion indexed or benchmarked to the index, with indexed assets comprising approximately USD 4.6 trillion of this total. The index includes 500 leading companies and covers approximately 80% of available market capitalization. The Nasdaq Composite Index is a large market-cap-weighted index of more than 2,500 stocks, American depositary receipts (ADRs), and real estate investment trusts (REITs), among others. The Dow Jones Industrial Average (DJIA), also known as the Dow 30, is a stock market index that tracks 30 large, publicly-owned blue-chip companies trading on the New York Stock Exchange (NYSE) and the Nasdaq. The Russell 2000 index measures the performance of approximately 2,000 smallest-cap American companies in the Russell 3000 Index. The MSCI ACWI Index, MSCI’s flagship global equity index, is designed to represent performance of the full opportunity set of large- and mid-cap stocks across 23 developed and 27 emerging markets. As of November 2020, it covers more than 3,000 constituents across 11 sectors and approximately 85% of the free float-adjusted market capitalization in each market. The MSCI Emerging Markets Value Index captures large- and mid-cap securities exhibiting overall value style characteristics across 27 Emerging Markets (EM) countries. The Bloomberg Barclays US Aggregate Bond is a broad-based flagship benchmark that measures the investment grade, US dollar-denominated, fixed-rate taxable bond market. The Bloomberg Commodity Index (BCOM) is calculated on an excess return basis and reflects commodity futures price movements. The index rebalances annually weighted 2/3 by trading volume and 1/3 by world production and weight-caps are applied at the commodity, sector and group level for diversification.
An index is not a security in which an investment can be made, as they are unmanaged vehicles that serve as market indicators only and do not account for the deduction of management fees and/or transaction costs generally associated with investable products. Advisory services are only offered to clients or prospective clients where Telemus and its representatives are properly licensed or exempt from licensure. No advice may be rendered by Telemus unless a client service agreement is in place. All composite data and corresponding calculations are available upon request.